+1.34 Billion Shiba Inu (SHIB) in 24 Hours: What's Behind the Fresh Volume?
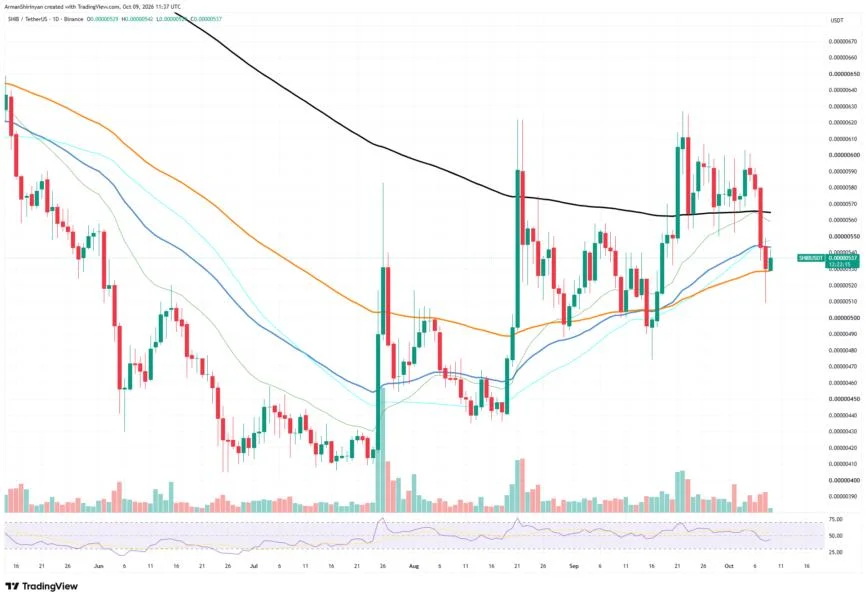
Shiba Inu has traded 1.34 billion SHIB in new volume over the past 24 hours. Following the , volume jumped after more than $1 billion in leveraged positions were wiped out. Most of this trading activity looks like a reaction to the crash: first forced sellers, then . The chart supports this observation.The descend is fueledSHIB went from $0.00000580 to $0.00000534 in two days, with the heaviest trading volume of the week appearing in a red candle. The price reached a low of $0.00000510 on Thursday and then began to recover. The long lower wick shows that buyers stepped in near the bottom. SHIB is currently trading at $0.00000534, right on the orange average of $0.00000529.COINBASE:SHIBUSDT Chart by TradingView">Support is key in this instance. The most recent daily candle is green, showing that it held. Volume on the bounce has been small so far, which indicates that the recovery is not yet confirmed. A cluster of moving averages near $0.00000545 to $0.00000549, positioned above the price, acts as the first wall. The longer black line close to $0.00000565 represents a significant test. SHIB failed to hold it this week and must regain it to turn the trend positive once more.The RSI is around 44, which shows weakness but not oversold conditions. Sellers therefore still hold a minor edge. A daily close above $0.00000549 would be the initial positive indicator for bulls.Bulls are aiming way higherAfter that, bulls should aim for $0.00000565, then $0.00000580, and ultimately $0.00000600. Bears would cancel the recent bounce with a close below $0.00000529. The next support is at $0.00000510, followed by $0.00000500.This zone was also in play in September. Looking ahead, fresh volume near support levels is a positive indicator, but sustained momentum is required. If SHIB holds $0.00000529 with high volume on green candles, a move to $0.00000565 is feasible. Otherwise, expect another test at $0.00000510.