Dogecoin (DOGE) Adds 30% in Trading Volume in 24 Hours as Spot Inflows Cross 1,000% Mark
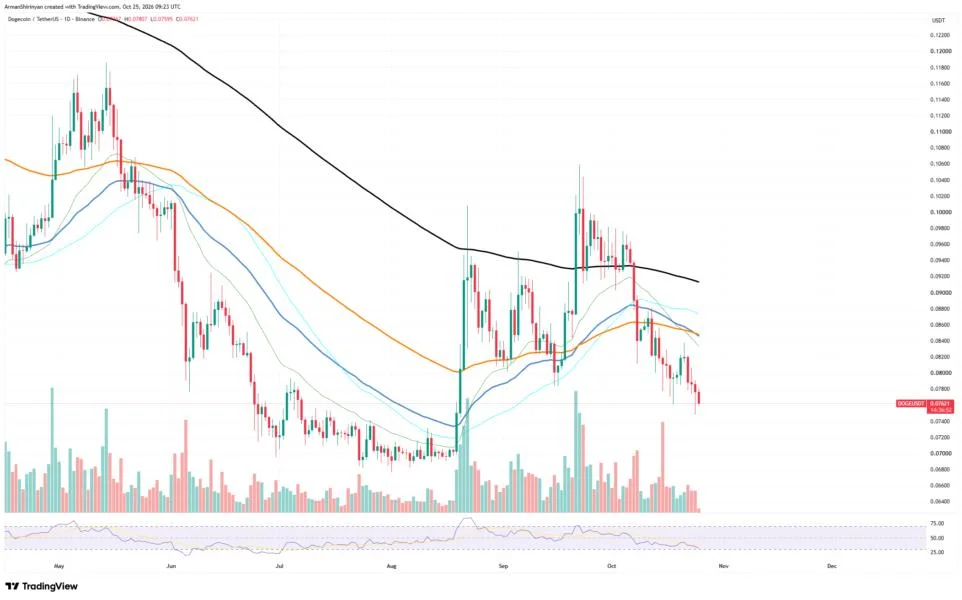
Dogecoin is displaying an unexpected surge in interest, while its price remains under pressure. DOGE trades close to $0.0767, down approximately 1.3% on the day. At the same time, , has risen by approximately 19% in 24 hours, and several other platforms show much stronger gains.Dogecoin Volume Surges Despite Price PressureOKX volume is up approximately 49% and Bitget is up approximately 79%. Spot flows deliver the most striking figure. In the last hour, spot inflows reached $1.35 million against $1.12 million in outflows, a net inflow of approximately $225,000. That is a change of more than 1,300% compared to the previous period. The size is small, but the jump indicates that some buyers are stepping in near the lows.COINBASE:DOGEUSDT Chart by TradingView">Over longer periods, the picture is weaker. Spot flows over 4, 8, and 12 hours are all negative, and the 24-hour net outflow is near $9 million.DOGE Technical Picture and DerivativesThe chart still looks heavy. DOGE is down approximately 20% over 30 days, 34% since the start of the year, and 61% over the last year. The price sits under all key moving averages, and the 50- and 100-day lines near $0.0850 now act as strong resistance. The 200-day average is much higher, near $0.0915. , which is close to oversold territory but not yet at the level that often brings a bounce.Support sits at $0.0750, where the latest wick found buyers. A drop below it could send DOGE toward $0.0720 and then $0.0700, a round level that held the price in the summer.On the upside, DOGE must first win back $0.0800. Above that, $0.0850 is the main target for bulls.Derivatives data leans to the bullish side. Long-to-short ratios are 2.7 on Binance and 4.7 on OKX, so most accounts are betting on a rise. Over the last 24 hours, long liquidations of $5.26 million were slightly higher than short liquidations of $4.82 million. Futures flows were positive in the short term, but they turned negative over 4 to 12 hours.Open interest is near $1.11 billion, and the market cap is approximately $12 billion. For now, the rise in volume is a good sign, but DOGE needs a close above $0.0800 to show real strength.